What is Technical Analysis?
Technical Analysis (TA) is the study of price charts and trading volumes to predict future price movements. Unlike fundamental analysis (which looks at project value), TA focuses purely on market psychology and historical patterns.
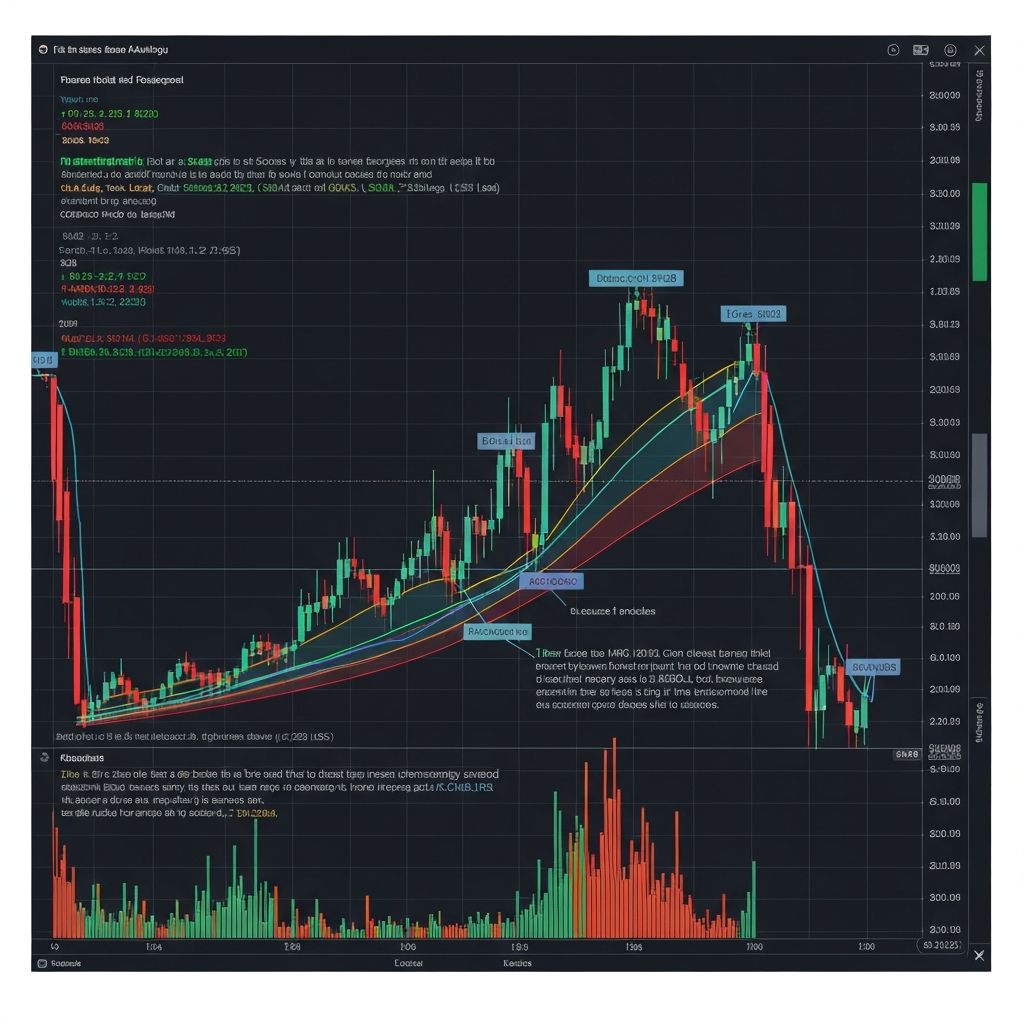
Understanding Candlestick Charts
Candlestick charts are the foundation of technical analysis. Each candle shows four key data points: open price, close price, high, and low. Green candles indicate price increases (bullish), while red candles show decreases (bearish).
Key Concepts: Support and Resistance
Support is a price level where buyers tend to enter, preventing further declines. Resistance is where sellers emerge, capping upward movement. When price breaks through resistance, it often becomes the new support level (and vice versa).
Essential Indicators for Beginners
- Moving Averages (MA): Show average price over time. When short-term MA crosses above long-term MA, it's a buy signal (Golden Cross).
- RSI (Relative Strength Index): Measures momentum. Above 70 = overbought (potential sell), below 30 = oversold (potential buy).
- MACD (Moving Average Convergence Divergence): Shows trend direction and momentum. When MACD line crosses above signal line, it's bullish.
- Volume: Confirms trend strength. Rising prices with high volume = strong trend. Rising prices with low volume = weak trend likely to reverse.
Chart Patterns: What to Look For
Bullish Patterns: Double Bottom, Cup and Handle, Ascending Triangle – indicate potential price increases.
Bearish Patterns: Double Top, Head and Shoulders, Descending Triangle – suggest upcoming declines.
Timeframes Matter
Different timeframes tell different stories. Day traders focus on 5-minute to 1-hour charts. Swing traders use 4-hour to daily charts. Long-term investors look at weekly and monthly charts. Always check multiple timeframes before making decisions.
Common Mistakes to Avoid
- Using too many indicators (stick to 2-3 maximum)
- Ignoring the bigger picture (zoom out to see overall trend)
- Trading against the trend (trend is your friend)
- Not waiting for confirmation (one indicator isn't enough)
Practice Makes Perfect
Use demo accounts or paper trading to practice TA without risking real money. Track your predictions and learn from mistakes. Over time, you'll develop an intuition for reading charts and identifying profitable opportunities.
When TA Isn't Enough
Remember that technical analysis isn't perfect. Major news events, regulatory changes, and black swan events can override technical signals. This is why platforms like Jin-Zhi combine TA with AI analysis and fundamental research for more reliable results.